< Contents
4. Create data dashboards
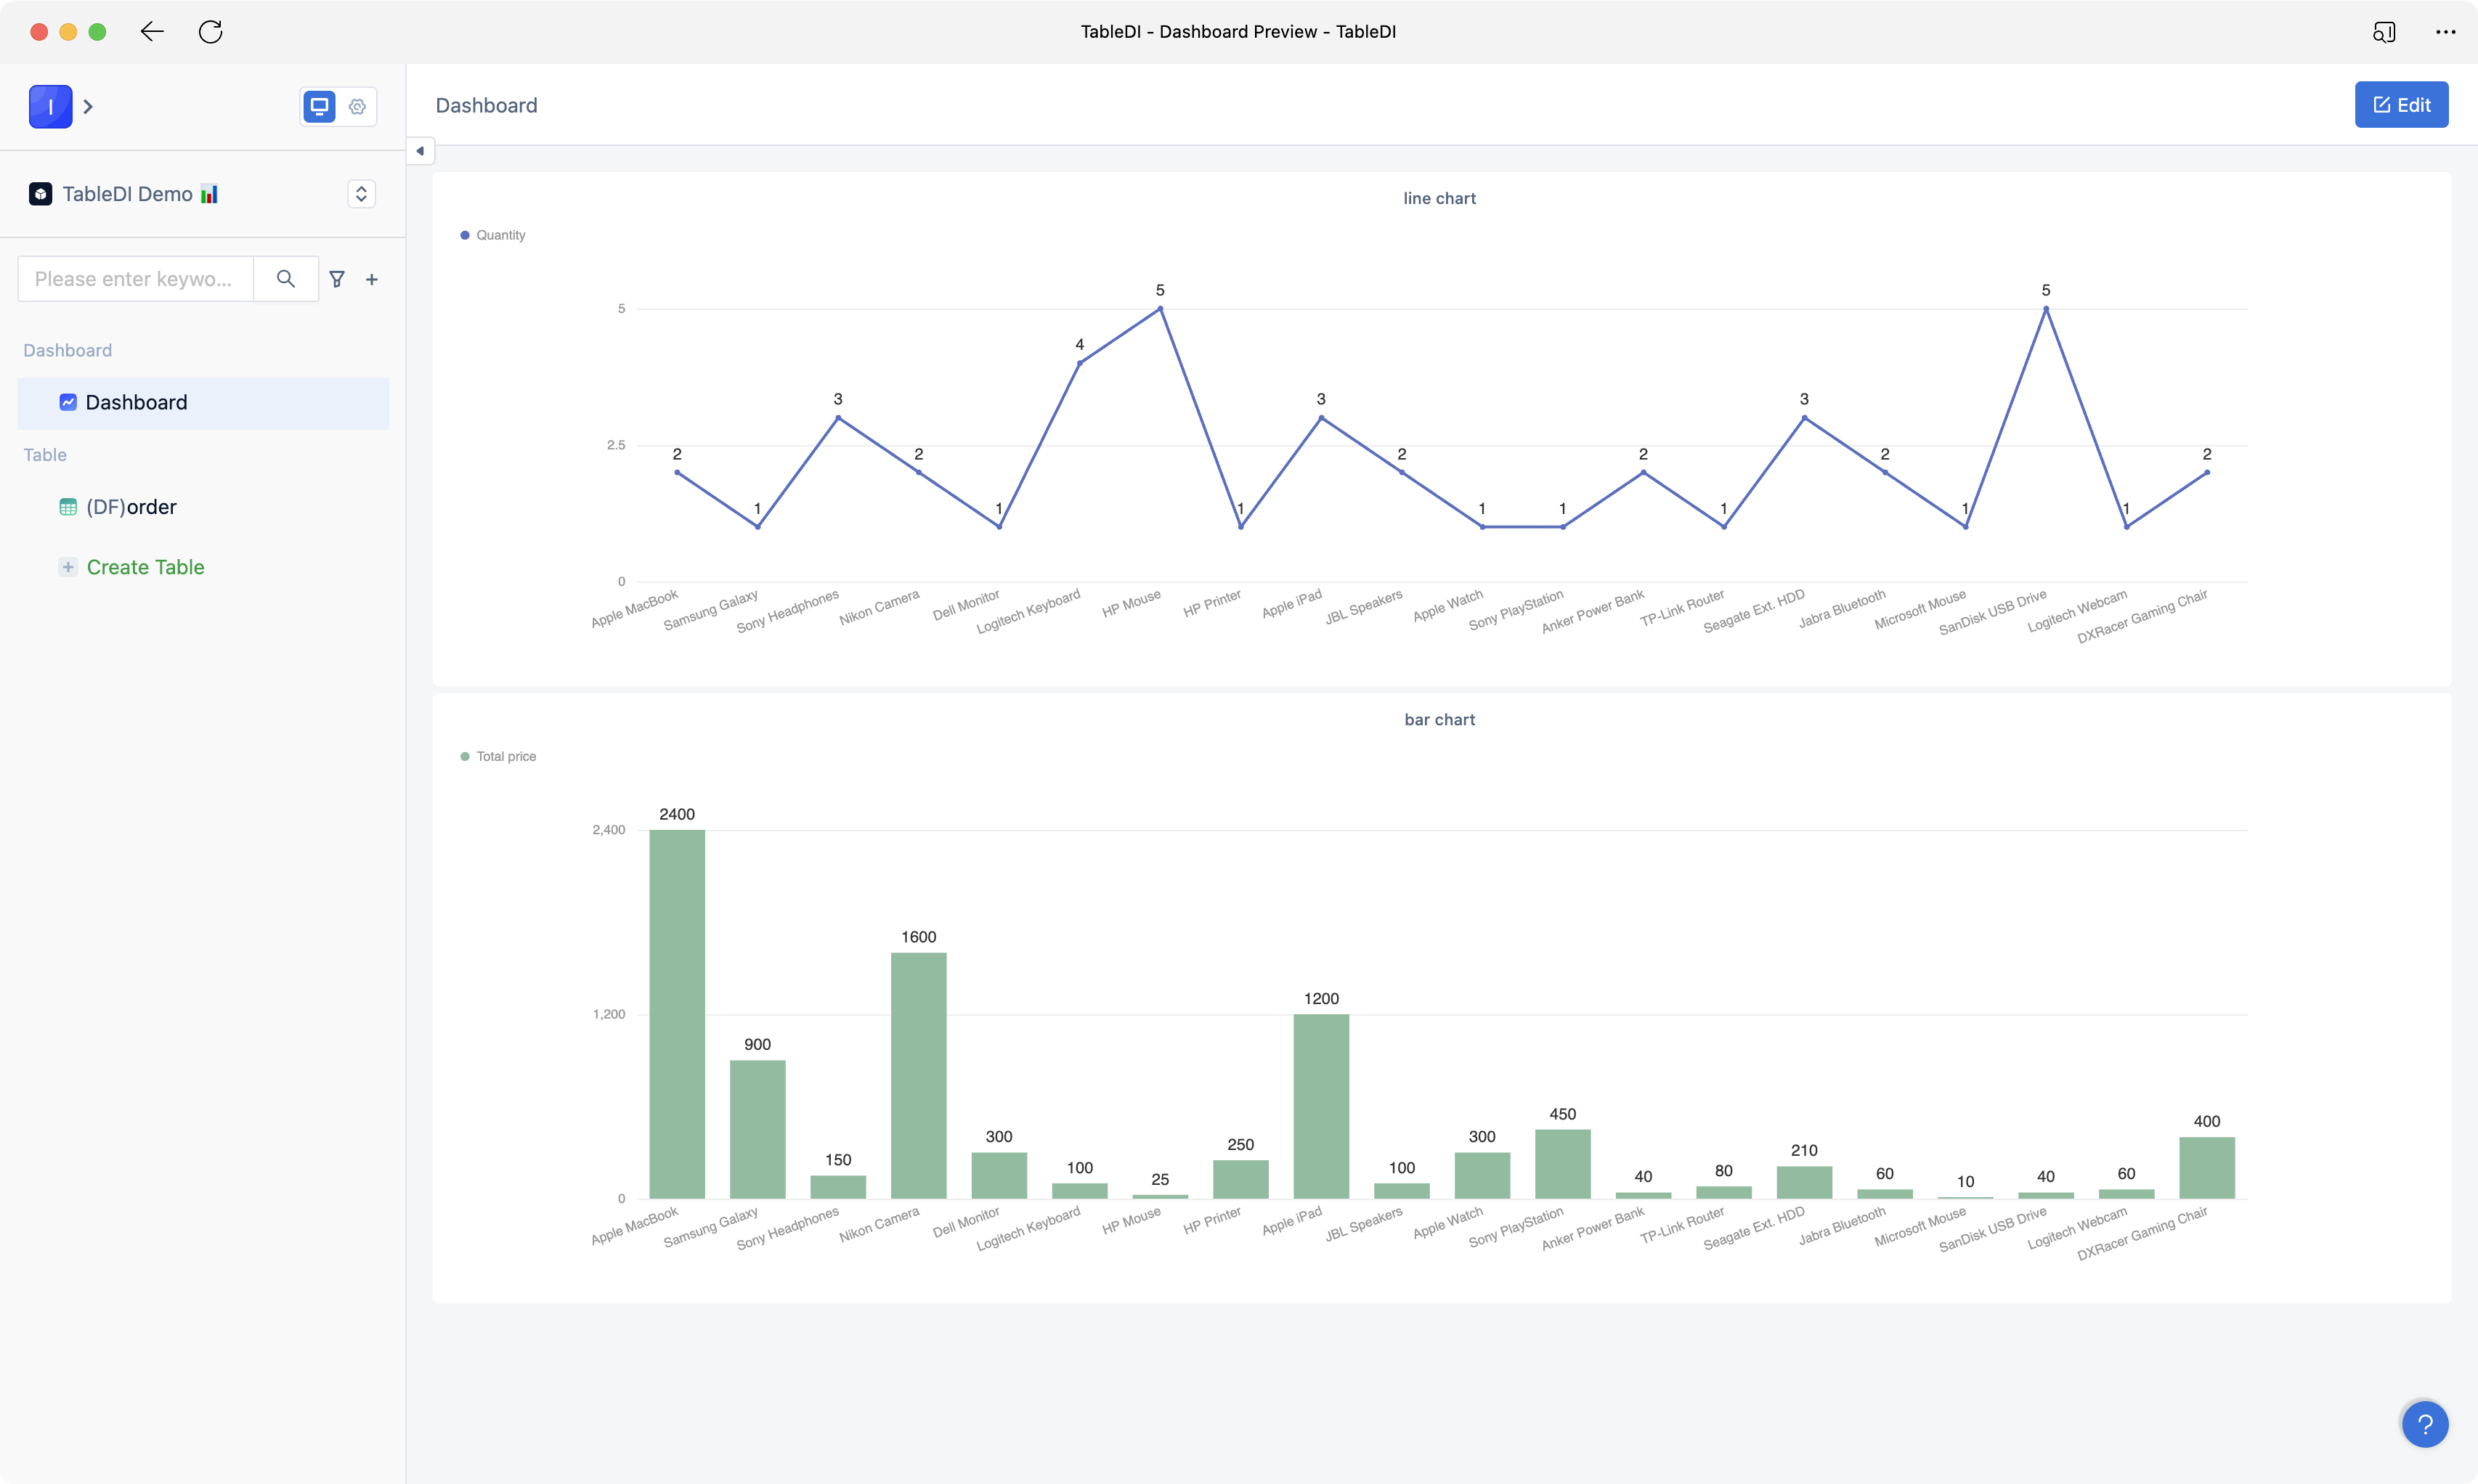
💡 After users have completed their data processing, they often create multiple data views to observe data from different dimensions. To facilitate a more intuitive data observation, these views can be consolidated and displayed using a data dashboard. Tablize provides the capability to create data dashboards that can combine multiple data views, data filters, and non-data views for a comprehensive display.
📖 This document will provide an example of how to create a basic data dashboard in Tablize to help you quickly understand its capabilities.
Tablize has prepared sample data for you, which you can download here: Sample Data.
Creating a New Dashboard
- In any data view, click on the three dots in the upper-right corner, then select "Display with multiple views" and choose "New Dashboard."
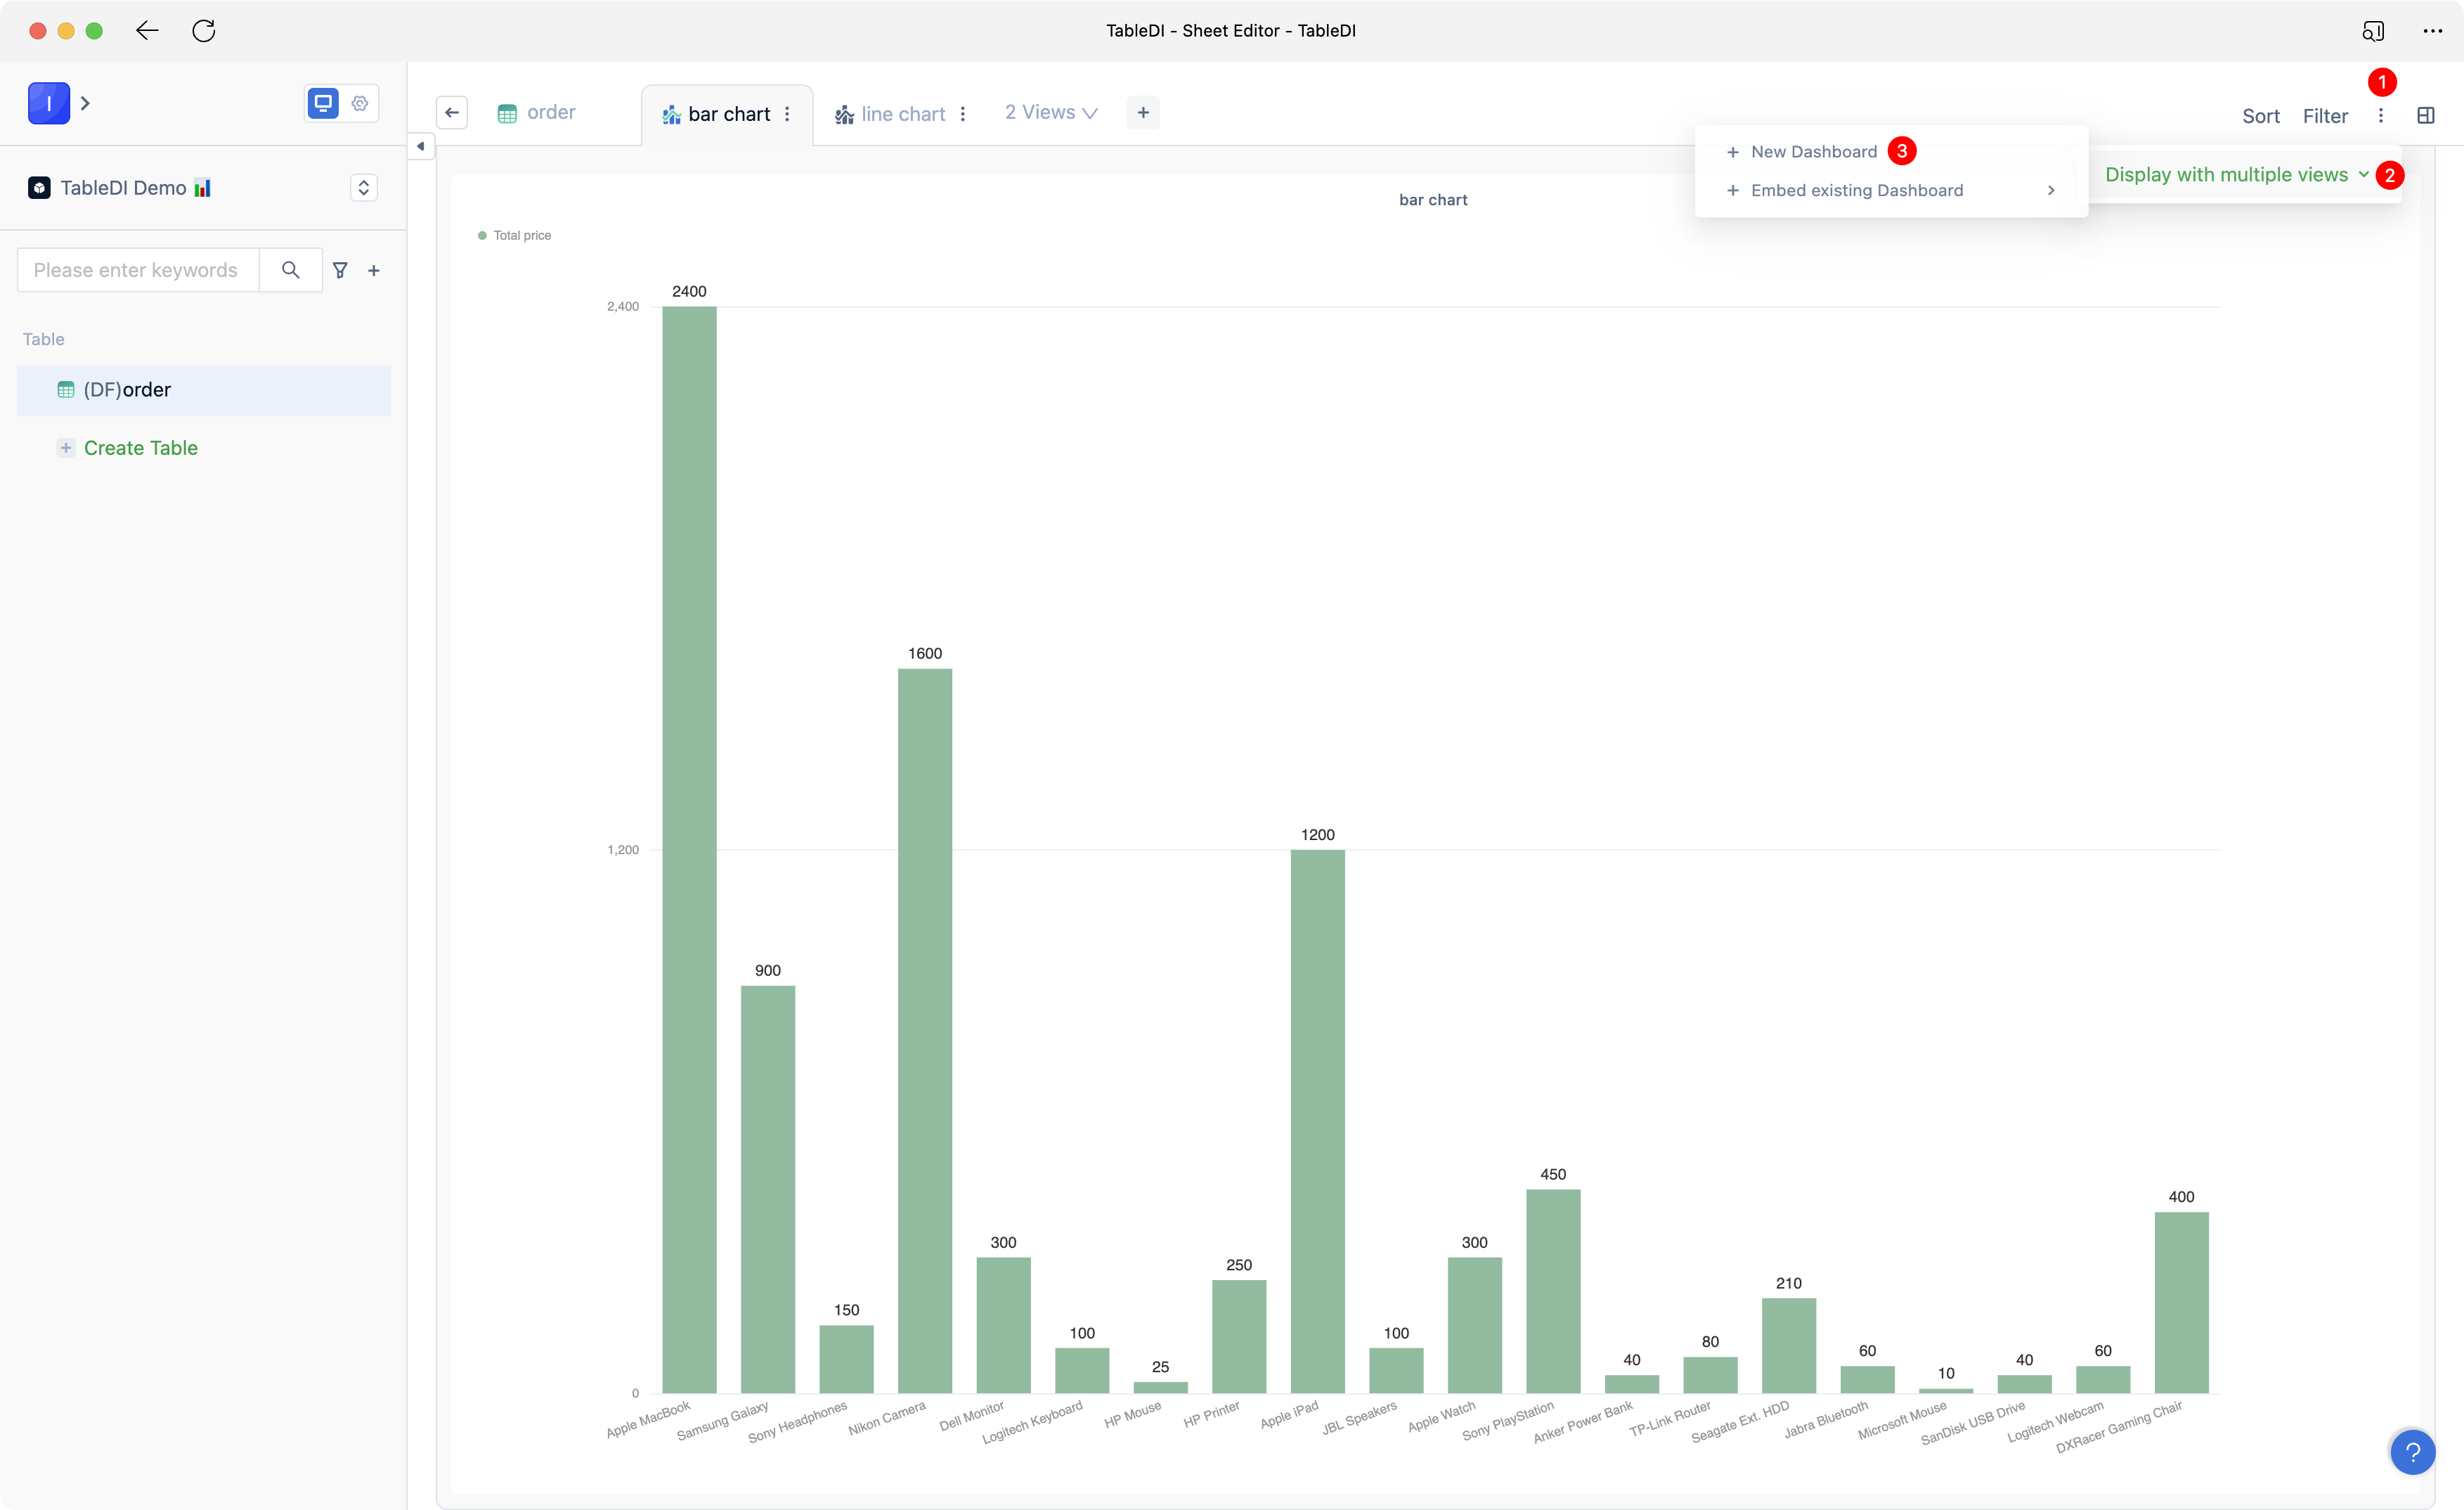
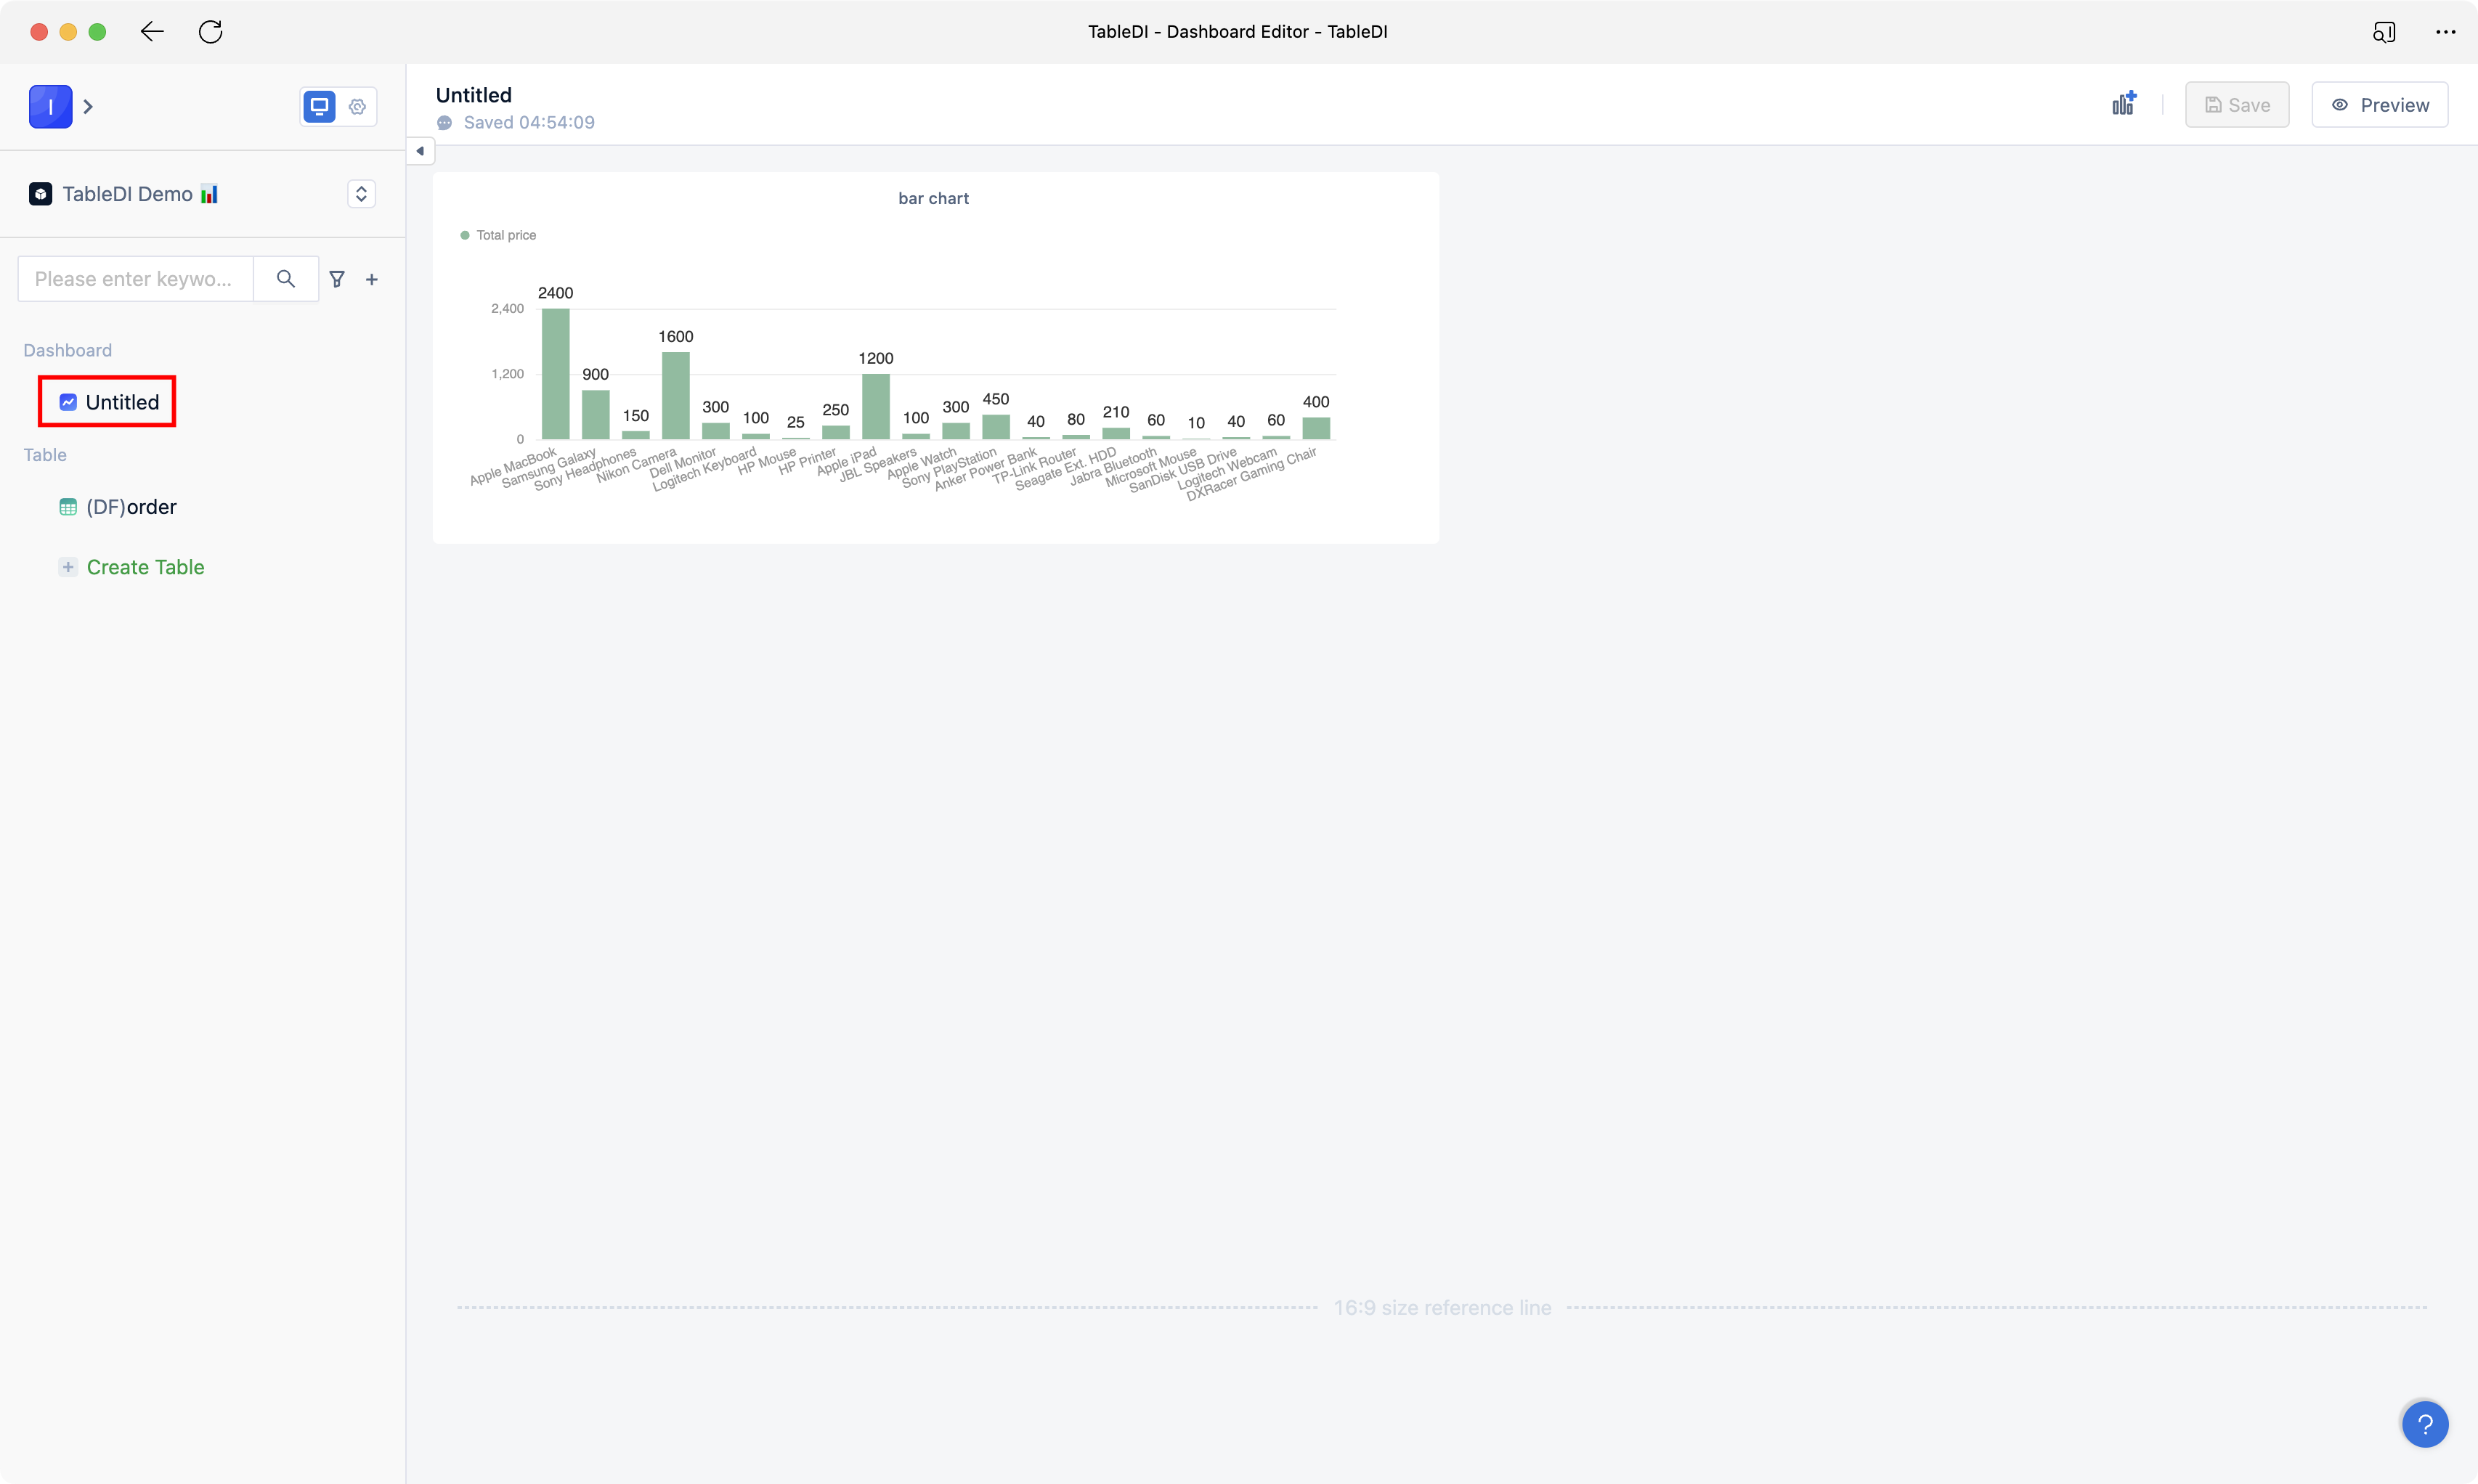
- Selecting "New Dashboard" will create a new data dashboard, and the current data view will be placed into the dashboard.
Adding Data Views to the Dashboard
- Click on the icon to add views in the upper-right corner, then choose "Add Data View."
- Select the relevant data table and choose the data view you want to add to the dashboard.
Editing the Dashboard
- Once the data views are added, you can customize their size and position to create your own customized data dashboard according to your needs.